3D Graphing
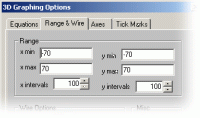 |
With more graphing options than ever to choose from, you are sure to find the right combination to fit your needs. Modify and display up to 6 equations, change the range and resolution of the plotted graphs, manipulate the axis and tick marks to allow easy analysis of the drawn graphs |
|
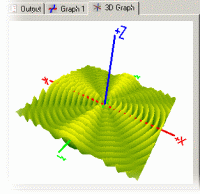
Using OpenGL to render the graphs, hardware acceleration is widely available on most recent video cards. Shown to the right is z(x,y) = (cos(sqrt(((x+0)^2)+((y+0)^2))) + cos(sqrt(((x+.913*2pi)^2)+((y+0)^2))) + cos(sqrt(((x-.913*2pi)^2)+((y+0)^2))))*4 A complicated equation that can be used to model wave interactions. |
 |
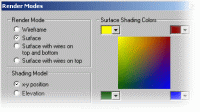 |
4 different render modes and 2 different shading models provides the flexibility you need to make the most of your graph. Custom colors allow your function to reveal the detail you are looking for. |
2D Graphing
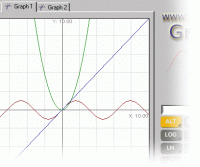 |
GraphCalc supports multiple graphing tabs so you can work with many functions at once without having a cluttered up view. Each graphing tab can also display up to 10 functions, each in its own custom color. |
|
In the graphing options you can enter your equations and customize the color for each. If you no longer want to display an equation, but don’t want to remove it from the options, just uncheck the box next to it. |
 |
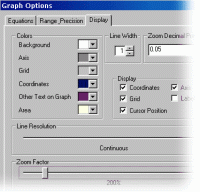 |
You have the options of turning the grid, labels, coordinates, and axes on or off. If you are on a slower computer you can choose to turn the resolution of graphing down to speed up the graphing, yet still be able to see the form of a graph. You can change the zoom factor so that when you zoom in through one of the many ways in GraphCalc, the amount that it zooms will be different. |
Program Options
|
ToolTips are attached to every button, giving you a brief description of what the button does. |
 |
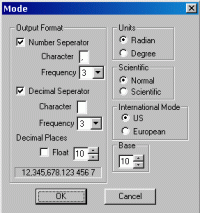 |
The program options allow you to change the base in which GraphCalc runs, set the number of decimal places to display in the output, handle angles in degrees or radians, and set the GraphCalc to display answers in scientific notation or not. |
Output
 |
When converting an expression from one base to another, the “convbase” operator is used. The output has a subscript of the base that the answer is begin displayed in. |
|
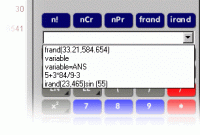
A drop down menu holds a history of all the expressions you have evaluated. This allows for easy access to expressions you may want to evaluate again or modify slightly, without having to type in the entire expression again. |
 |
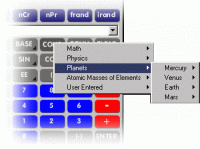 |
The constant menu is a large database of over 1500 constants. These constants are read in from a file at program startup and can easily be edited so that you can expand the database. This menu also contains a section for all the constants that you have entered since the program started. |
